1. Introduction
The Dropwizard Metrics Graphite plugin provides capabilities for metrics reporting through Graphite for Grails 3 applications. It depends on the core Dropwizard Metrics plugin.
2. Installation
To add the Dropwizard Metrics Graphite plugin to an application, add the following dependency to the dependencies block of your build.gradle:
compile "org.grails.plugins:dropwizard-metrics-graphite:1.0.0.M1"This plugin depends on version 1.0.0.M3+ of the core Dropwizard Metrics plugin, so you will also need to declare the following dependency:
compile "org.grails.plugins:dropwizard-metrics-:1.0.0.M3+"3. Metrics Reporting
The plugin provides support for automatically reporting metrics at a scheduled interval using the Dropwizard GraphiteReporter. You can also use it as an example of one approach for adding your own reporter.
The reporter is enabled and configured under the confuration key grails.dropwizard.metrics. Since this plugin
is dependent on the dropwizard-metrics core plugin, all of its ScheduledReporters are also available. See its
docs for a compete description of the metrics reporters available through that plugin.
Note: For backward compatibility, the Slf4jReporter is active by default and must be explicitly turned off
in configuration if reporting metrics through the Slf4j logger is not desired.
To enable reporting of metrics to Graphite, first assign a value to the config property named
reporterFrequency to indicate how often the reporting should occur. The value represents the
reporting interval in seconds.
grails:
    dropwizard:
        metrics:
            reporterFrequency: 30 # report every 30 seconds
If reporterFrequency is missing or has a value of zero, metric reporting will not occur.
For reference as we discuss the various reporters, a SimpleService was created with a @Metered
method:
package demo.dropwizard

import grails.gorm.transactions.Transactional
import grails.plugin.dropwizard.metrics.meters.Metered

@Transactional(readOnly = true)
class SimpleService {

    @Metered('sayHello meter')
    String sayHello(String name) {
        name ? "Hello ${name}!" : 'Hello Stranger!'
    }

    @Metered('sayGoodbye meter')
    String sayGoodbye(String name) {
        name ? "Goodbye ${name}!" : 'Goodbye Stranger!'
    }
}
3.1. Slf4jReporter
The Slf4jReporter reports metrics via a Slf4j logger named grails.plugin.dropwizard.DropwizardMetricsGrailsPlugin at
the INFO level. You may want to configure the level for that logger in grails-app/conf/logback.groovy
as shown below.
logger 'grails.plugin.dropwizard.DropwizardMetricsGrailsPlugin',
        INFO, ['STDOUT'], false
For backward compatibility, this reporter is active by default. However, adding slf4j-reporter.active configuration
can explicitly enable or disable the Slf4j reporter:
grails:
    dropwizard:
        metrics:
            reporterFrequency: 10 # report every 10 seconds
            slf4j-reporter.active: false
When active, the Slf4jReporter metric reporting to the configured logger looks like this:
2017-10-07 11:06:30.820  INFO --- [rter-1-thread-1] com.codahale.metrics.Slf4jReporter : type=GAUGE, name=gauge.response.metrics, value=2.0
2017-10-07 11:06:30.820  INFO --- [rter-1-thread-1] com.codahale.metrics.Slf4jReporter : type=GAUGE, name=gauge.response.sayHello.Fred, value=3.0
2017-10-07 11:06:30.820  INFO --- [rter-1-thread-1] com.codahale.metrics.Slf4jReporter : type=COUNTER, name=counter.status.200.metrics, count=2
2017-10-07 11:06:30.820  INFO --- [rter-1-thread-1] com.codahale.metrics.Slf4jReporter : type=COUNTER, name=counter.status.200.sayHello.Fred, count=10
2017-10-07 11:06:30.820  INFO --- [rter-1-thread-1] com.codahale.metrics.Slf4jReporter : type=METER, name=sayHello meter, count=10, mean_rate=0.010176484138111742, m1=1.7528496438887441E-7, m5=0.077548415663444, m15=0.6769308502134816, rate_unit=events/second
3.2. GraphiteReporter
The GraphiteReporter is used to report metrics to a Graphite server.
To configure it, declare grails.dropwizard.metrics.graphite-reporter.active: true in configuration.
Below we see all the configuration options for the Graphite reporter, though all except active have default values.
Note: Since we didn’t explicitly declare the
slf4j-reporter.active: false, the metrics would also be logged to the Slf4j logger as well as reported to the
Graphite server.
grails:
    dropwizard:
        metrics:
            reporterFrequency: 10 # report every 10 seconds
            graphite-reporter:
                active: true
                graphite-metric-prefix: sales.acme.com      # default: graphite.localhost
                graphite-server: graphite.acme.com          # default: localhost
                graphite-server-port: 2003                  # default: 2003
                graphite-metric-filter: 'goodbyeFilter'     # default: graphiteMetricFilter
Below are the descriptions of the graphite-* configuration options:
3.2.1. graphite-metric-prefix
A single Graphite server may receive metrics from many applications. To delineate the source of the metrics,
you can provide a metric prefix; i.e. sales.acme.com as shown in the Graphite display below:
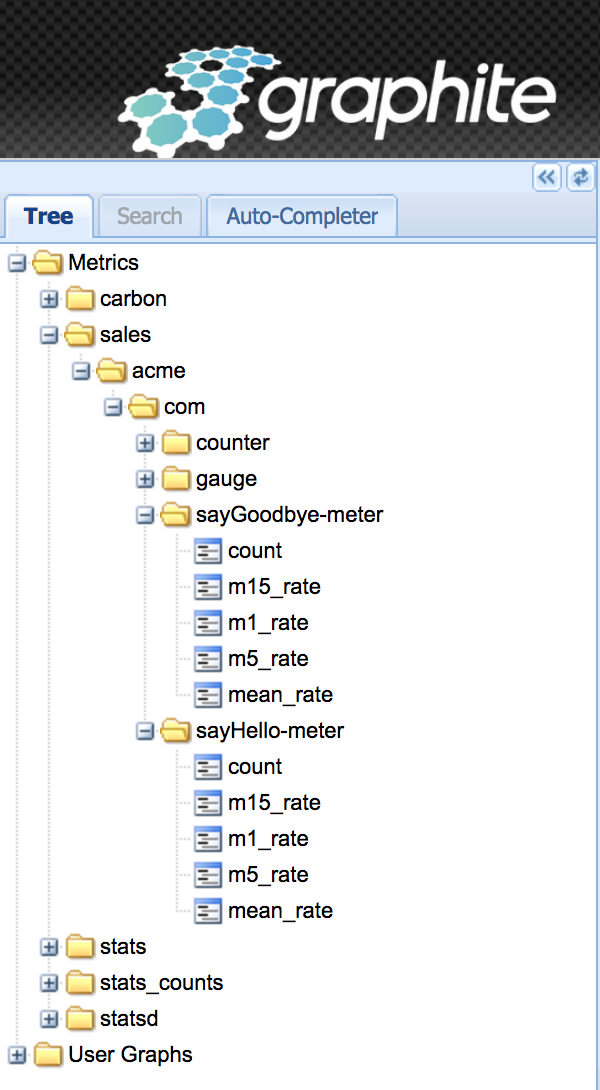
The default value is graphite.localhost so you will want to specify a more meaningful prefix.
3.2.2. graphite-server
This is the DNS or IP address of the Graphite server. The default is localhost which is fine for development,
but you will likely want to provide something more specific, as shown above with graphite.acme.com.
3.2.3. graphite-server-port
The default Graphite server port is 2003, but you can override that with the graphite-server-port
configuration.
3.2.4. graphite-metric-filter
This configuration allows tou to specify the name of a Spring bean that implements the Dropwizard
MetricFilter interface defined as:
package com.codahale.metrics;

/**
 * A filter used to determine whether or not a metric should be reported, among other things.
 */
public interface MetricFilter {
    /**
     * Matches all metrics, regardless of type or name.
     */
    MetricFilter ALL = new MetricFilter() {
        @Override
        public boolean matches(String name, Metric metric) {
            return true;
        }
    };

    /**
     * Returns {@code true} if the metric matches the filter; {@code false} otherwise.
     *
     * @param name      the metric's name
     * @param metric    the metric
     * @return {@code true} if the metric matches the filter
     */
    boolean matches(String name, Metric metric);
}
The default value is a bean named graphiteMetricFilter which is simply the MetricFilter.ALL
implementation shown above. That filter allows all metrics sent to the Graphite server to be
processed.
You can create a custom filter and register it as a Spring bean. For example, the following
GoodbyeFilter class would be used to filter the metrics based on the name of the filter containing
the text goodbye in the name of the metric.
package demo.dropwizard

import com.codahale.metrics.Metric
import com.codahale.metrics.MetricFilter

class GoodbyeFilter implements MetricFilter {

    @Override
    boolean matches(String name, Metric metric) {
        name.toLowerCase().contains 'goodbye'
    }
}
A Spring bean is then declared in conf/spring/resources.groovy with the name goodbyeFilter
as shown below:
package spring

import demo.dropwizard.GoodbyeFilter

beans = {
    goodbyeFilter(GoodbyeFilter)
}
The example SimpleService above defined two metered methods, sayHello meter and sayGoodbye meter.
When this filter is specified, the only metrics handled by Graphite will be those with the case
insensitive word goodbye in their name. Despite sending messages to the sayHello meter and
sayGoodbye meter methods, only the sayGoodbye events will be handled by Graphite.
3.3. For more information
For details on Dropwizard GraphiteReporter see http://metrics.dropwizard.io/3.1.0/manual/graphite/
For more information on Graphite, see http://graphiteapp.org/
4. Graphite Server
The Graphite app website offers instructions on installing the Graphite service.
For development, perhaps the best and easiest way is to not install it at all and simply run it within a Docker container. You can download and launch a Docker container with a pre-installed Graphite server using this command:
docker run -d\
--name graphite\
--restart=always\
-p 80:80\
-p 2003-2004:2003-2004\
-p 2023-2024:2023-2024\
-p 8125:8125/udp\
-p 8126:8126\
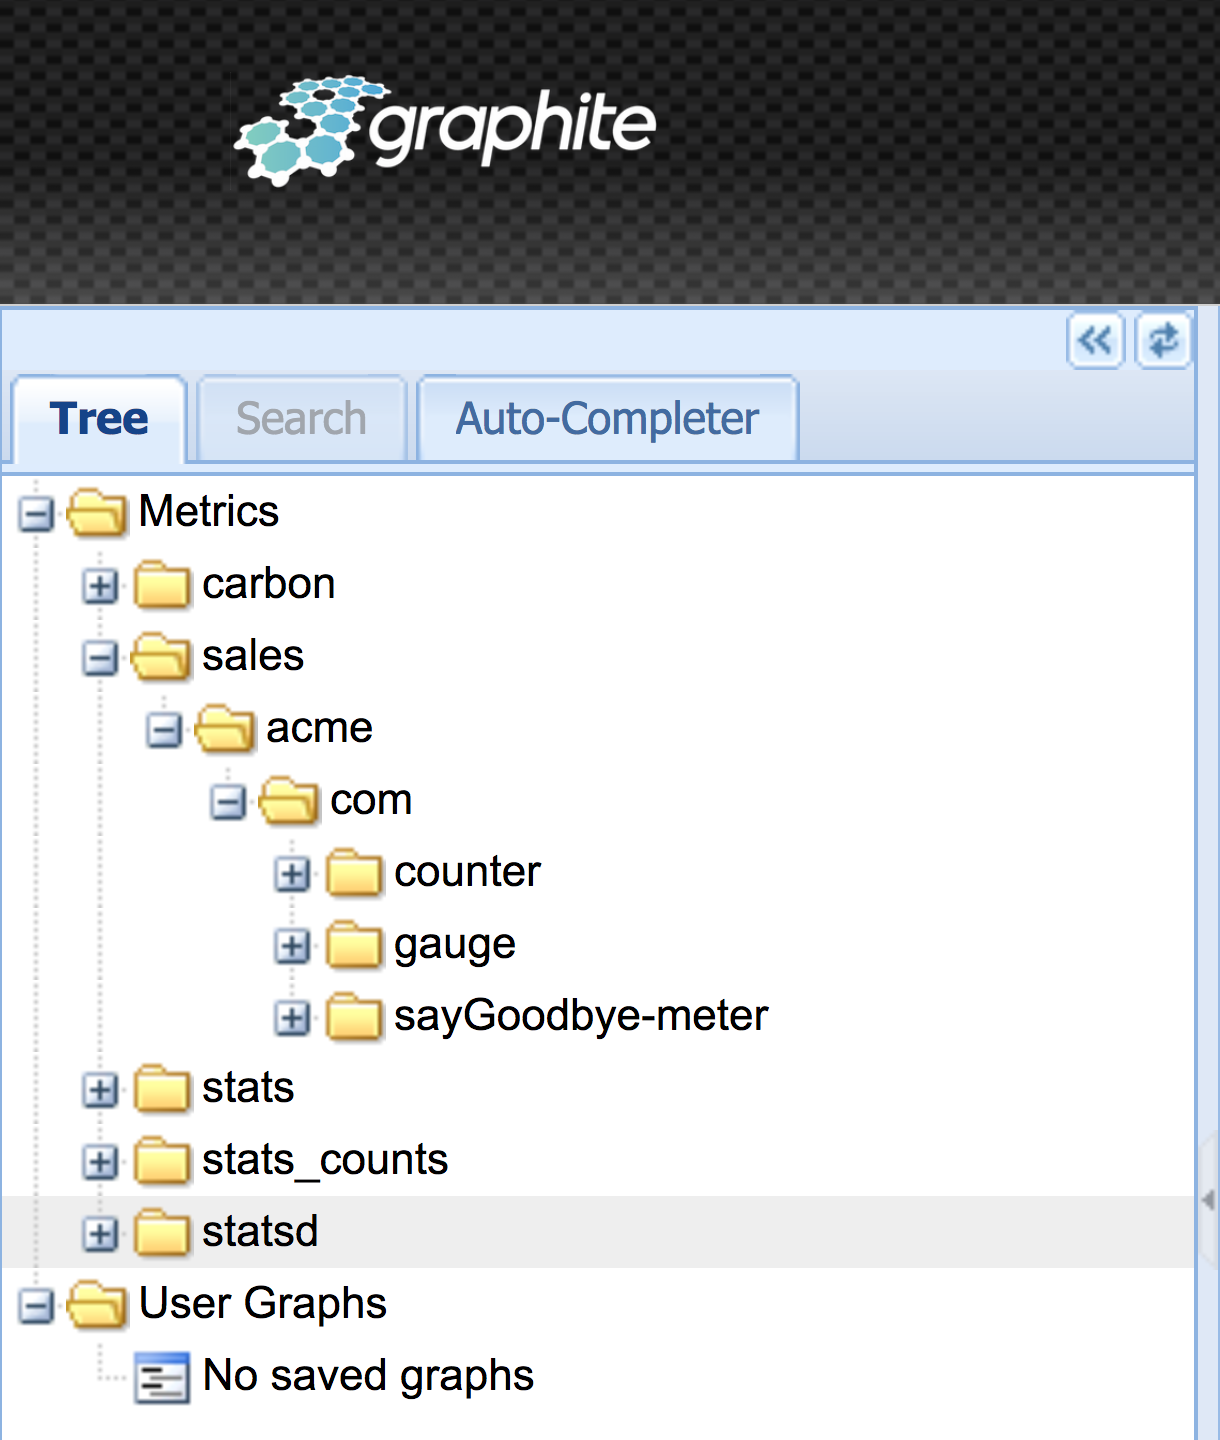
graphiteapp/graphite-statsdAfter starting the container, your application can feed metrics to graphite and you can view them using the Graphite server web application served from the container on port 80.
The left pane is a tree control showing various metrics, as shown below:
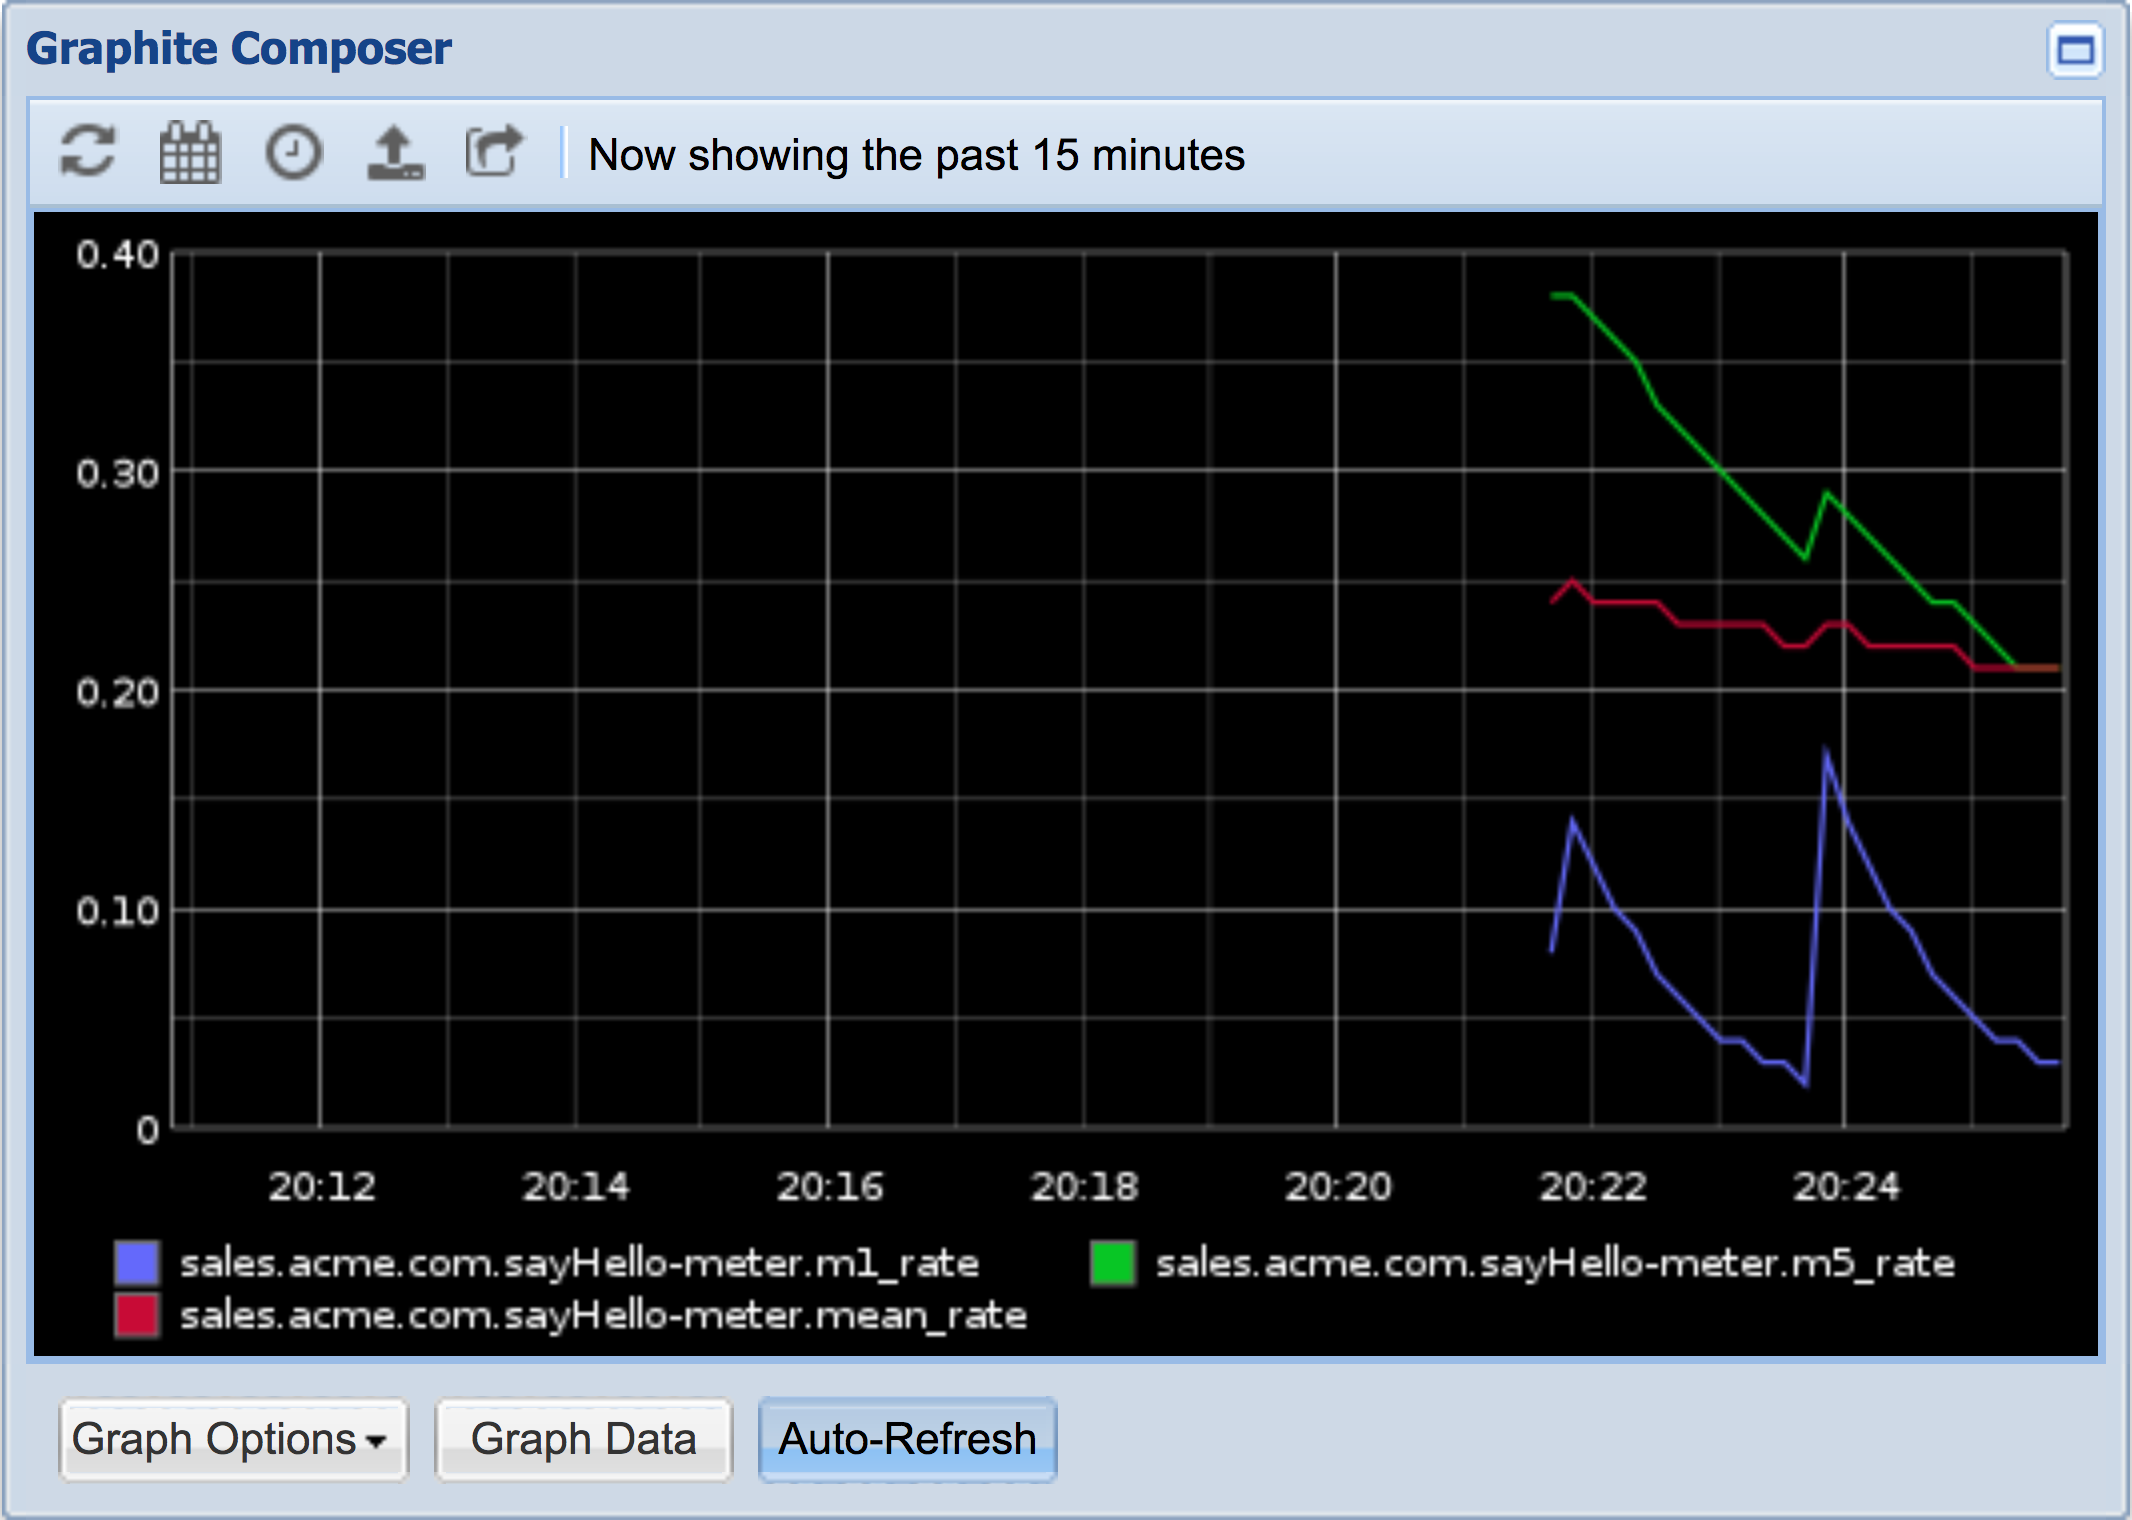
The main content area is a graph of the metrics being collected by Graphite:
4.1. For more information
Dropwizard GraphiteReporter page: http://metrics.dropwizard.io/3.1.0/manual/graphite/
Graphite home: http://graphiteapp.org/
Installing Graphite: https://graphite.readthedocs.io/en/latest/install.html
Graphite-Statsd Docker Image: https://github.com/graphite-project/docker-graphite-statsd
5. API Documentation
API documentation may be found here.